Monitoring(Prometheus + Grafana) 정복하기 - 2 (EKS 수집)
이제 EKS를 Terraform으로 간편하게 만들고, Prometheus와 Grafana를 적용해 보자.
EKS 생성 (With Terraform)
Github에서 볼 수 있고 사용 방법은 README를 보기 바란다.
시간이 약 10분 정도 걸리고, 완성된 것을 볼 수 있다.
EKS 세팅
(kubectl 설치 가정)
이제 로컬에서 kubectl을 사용할 수 있도록 kubeconfig를 업데이트해줘야 한다.
aws eks update-kubeconfig --region region-code --name my-cluster # 서울의 경우 ap-northeast-2
사용하면 ~/. kube로 이동하면 config파일이 업데이트된 것을 볼 수 있다.
이제 EKS를 cli로 다룰 수 있게 도와주는 eksctl을 자신의 os에 맞게 설치해 주면 된다.
eksctl 설치 설명 페이지
https://docs.aws.amazon.com/ko_kr/emr/latest/EMR-on-EKS-DevelopmentGuide/setting-up-eksctl.html
Terraform으로 생성 시 OCID는 자동으로 생성돼서, 스킵해도 된다. 별도로 생성한 경우 있는지 확인하고 생성해 주자.
cluster_name=my-cluster oidc_id=$(aws eks describe-cluster --name $cluster_name --query "cluster.identity.oidc.issuer" --output text | cut -d '/' -f 5) echo $oidc_id aws iam list-open-id-connect-providers | grep $oidc_id | cut -d "/" -f4 eksctl utils associate-iam-oidc-provider --cluster $cluster_name --approve
ALB 생성
ALB를 생성해 보자. 거기에 앞서 EKS를 생성할 때 사용했던, VPC와 Public Subnet에 태그를 설정해줘야 한다. 해주지 않으면 ALB가 인식하지 못한다.
만든 public subnet, vpc 태그에 kubernetes.io/role/elb = 1 추가

이제 아래의 명령어를 순서대로 실행시켜 주는데, 111122223333의 경우 자신의 AccountId를 입력해줘야 한다.
curl -O https://raw.githubusercontent.com/kubernetes-sigs/aws-load-balancer-controller/v2.5.4/docs/install/iam_policy.json aws iam create-policy \ --policy-name AWSLoadBalancerControllerIAMPolicy \ --policy-document file://iam_policy.json eksctl create iamserviceaccount \ --cluster=my-cluster \ --namespace=kube-system \ --name=aws-load-balancer-controller \ --role-name AmazonEKSLoadBalancerControllerRole \ --attach-policy-arn=arn:aws:iam::111122223333:policy/AWSLoadBalancerControllerIAMPolicy \ --approve brew install helm helm repo add eks https://aws.github.io/eks-charts helm repo update eks helm install aws-load-balancer-controller eks/aws-load-balancer-controller \ -n kube-system \ --set clusterName=my-cluster \ --set serviceAccount.create=false \ --set serviceAccount.name=aws-load-balancer-controller kubectl get deployment -n kube-system aws-load-balancer-controller
생성된 것을 확인해 보자.
Namespace 생성
그라파나와 프로메테우스에서 사용할 namespace 2개를 미리 만들어야 한다.
kubectl create ns prometheus kubectl create ns grafana
Ingress.yaml
첫 번째는 프로메테우스를 설치하고 확인할 예정이라서 아래와 같이 작성해 주자.
여기서 group.name 설정은 중요한데, 지정하지 않으면 namespace마다 LoadBalancer를 만들게 되므로 설정해 주자.
apiVersion: networking.k8s.io/v1 kind: Ingress metadata: name: ingress-monitoring namespace: prometheus annotations: alb.ingress.kubernetes.io/group.name: monitoring kubernetes.io/ingress.class: alb alb.ingress.kubernetes.io/scheme: internet-facing alb.ingress.kubernetes.io/target-type: ip alb.ingress.kubernetes.io/listen-ports: '[{"HTTP": 80}]' spec: rules: - http: paths: - path: /prometheus pathType: Prefix backend: service: name: prometheus-server port: number: 80
아직 프로메테우스 서비스를 생성하지 않았지만 실행은 된다.
kubectl apply -f ingress.yaml
ebs-csi-driver 생성
eksctl을 사용해서 ebs-csi-driver를 생성하는데, 역할은 EBS 볼륨을 kubernetes 내에서 사용할 수 있게 해 주는데, 프로메테우스와 그라파나에 볼륨을 할당해 주기 위함이다. helm 차트로 리소스들을 생성하는데 없으면 생성이 안된다.
이전에 ebs-csi-driver가 설치된 지 확인해 준다. 없으면 아래의 플로우를 실행해 주고, 있으면 Prometheus value.yaml 수정 파트부터 하면 된다.
aws eks describe-addon-versions --addon-name aws-ebs-csi-driver
iamserviceaccount를 생성
eksctl create iamserviceaccount \ --name ebs-csi-controller-sa \ --namespace kube-system \ --cluster my-cluster \ --role-name AmazonEKS_EBS_CSI_DriverRole \ --role-only \ --attach-policy-arn arn:aws:iam::aws:policy/service-role/AmazonEBSCSIDriverPolicy \ --approve
아래의 명령어로 파일을 만들고 아래의 json 파일을 넣어준다.
vim kms-key-for-encryption-on-ebs.json{ "Version": "2012-10-17", "Statement": [ { "Effect": "Allow", "Action": [ "kms:CreateGrant", "kms:ListGrants", "kms:RevokeGrant" ], "Resource": ["custom-key-arn"], "Condition": { "Bool": { "kms:GrantIsForAWSResource": "true" } } }, { "Effect": "Allow", "Action": [ "kms:Encrypt", "kms:Decrypt", "kms:ReEncrypt*", "kms:GenerateDataKey*", "kms:DescribeKey" ], "Resource": ["custom-key-arn"] } ] }
이제 json을 기반으로 정책을 생성해 준다.
aws iam create-policy \ --policy-name KMS_Key_For_Encryption_On_EBS_Policy \ --policy-document file://kms-key-for-encryption-on-ebs.json
이제 이전에 만든 iamserviceaccount에 위의 정책의 부착해 준다.
aws iam attach-role-policy \ --policy-arn arn:aws:iam::{자신의 account_id}:policy/KMS_Key_For_Encryption_On_EBS_Policy \ --role-name AmazonEKS_EBS_CSI_DriverRole
이제 eksctl 이용해서 addon을 생성해 준다.
eksctl create addon --name aws-ebs-csi-driver --cluster {자신의 cluster_name} --service-account-role-arn arn:aws:iam::{자신의 account_id}:role/AmazonEKS_EBS_CSI_DriverRole --force
아래의 명령어를 이용해서 확인해 본다.
eksctl get addon --name aws-ebs-csi-driver --cluster {자신의 cluster_name}

Prometheus values.yaml 수정
helm 차트를 이용해서 생성할 예정인데, 약간의 수정이 필요하기에 아래의 git을 클론 해서 values.yaml을 가져와야 한다.
git clone https://github.com/prometheus-community/helm-charts.git
charts/prometheus/values.yaml을 찾아서 편한 곳에 복사한다.
이제 values.yaml 내에서 1편에서 했던 것처럼 scrape시 basic_auth를 추가해줘야 한다.
아래의 문장으로 검색하면 kubernetes-pods, kubernetes-pods-slow 총 2개가 검색된다.
kubernetes-pods
밑에 자신이 설정한 아이디와 패스워드를 넣어준다.
basic_auth: username: {아이디} password: {비밀번호}
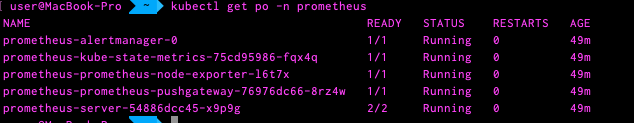
아래의 명령어를 순서대로 입력해 주면 생성된 것을 볼 수 있다.
helm repo add prometheus-community https://prometheus-community.github.io/helm-charts helm install prometheus prometheus-community/prometheus \ --namespace prometheus \ --set alertmanager.persistentVolume.storageClass="gp2" \ --set server.persistentVolume.storageClass="gp2" \ -f values.yaml kubectl get po -n prometheus
이제 로드밸런서를 검색해서 들어가 보면 아래와 같이 정상적으로 스크랩한 걸 볼 수 있다.
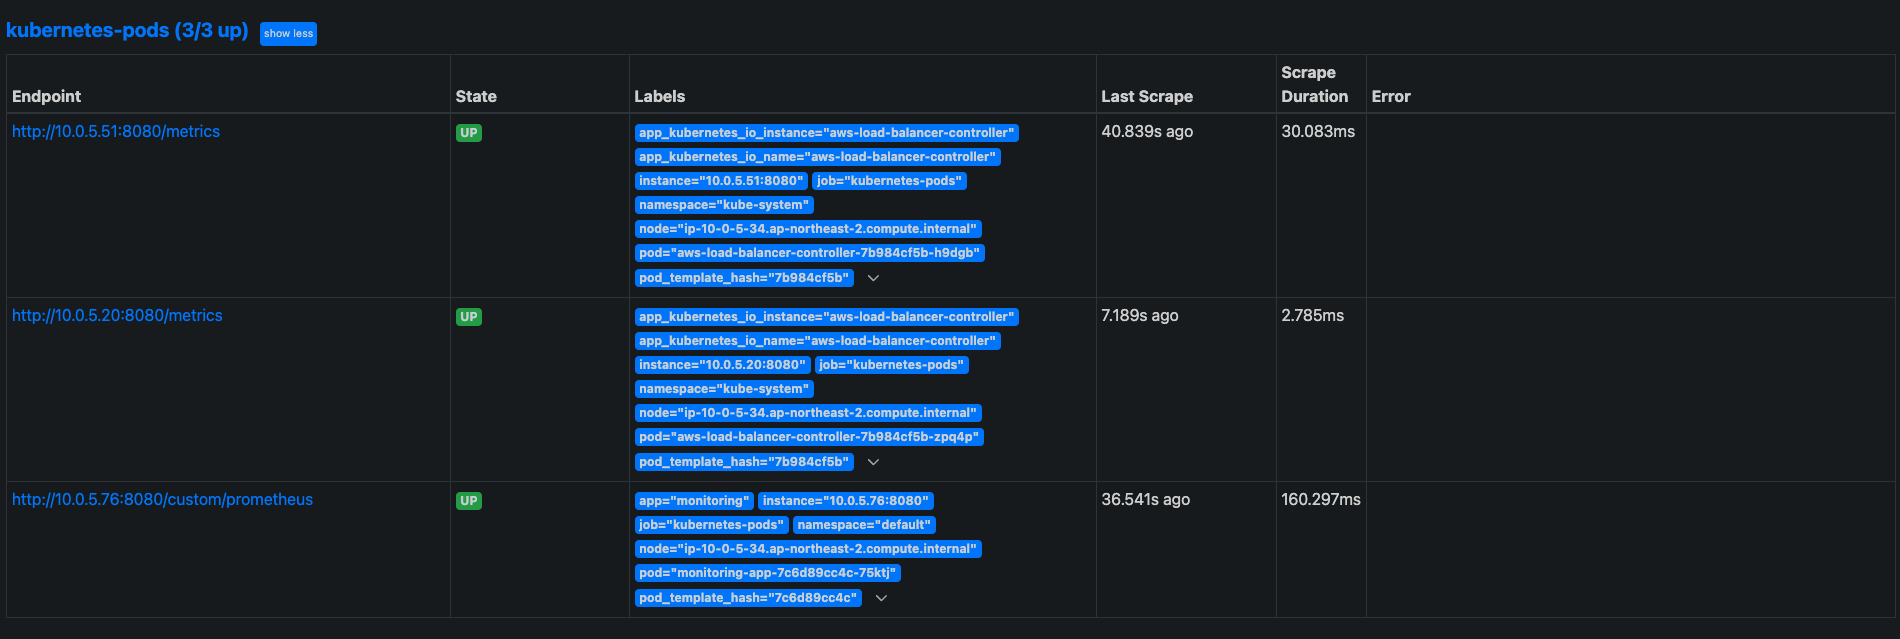
helm 차트로 생성하기에 보안 설정이 복잡해서 노출을 Public 상에 노출하지 않도록 하기 위해 ingress promethes는 삭제해야 한다.
grafana
이제 그라파나를 연동시켜야 한다. 순서대로 명령어를 실행시켜 준다.
helm repo add grafana https://grafana.github.io/helm-charts helm install grafana grafana/grafana \ --namespace grafana \ --set persistence.storageClassName="gp2" \ --set persistence.enabled=true \ --set adminPassword='{자신이 원하는 비밀번호 로그인시 사용됨}' \ --values ./grafana.yaml \ --set service.type=NodePort
이제 Ingress로 접근할 수 있도록 설정해줘야 한다.
apiVersion: networking.k8s.io/v1 kind: Ingress metadata: name: ingress-monitoring namespace: grafna annotations: alb.ingress.kubernetes.io/group.name: monitoring kubernetes.io/ingress.class: alb alb.ingress.kubernetes.io/scheme: internet-facing alb.ingress.kubernetes.io/target-type: ip alb.ingress.kubernetes.io/listen-ports: '[{"HTTP": 80}]' spec: rules: - http: paths: - path: /grafana pathType: Prefix backend: service: name: grafana port: number: 80
이제 로드밸런서의 도메인으로 접근하고 그라파나가 나오는 것을 볼 수 있다.
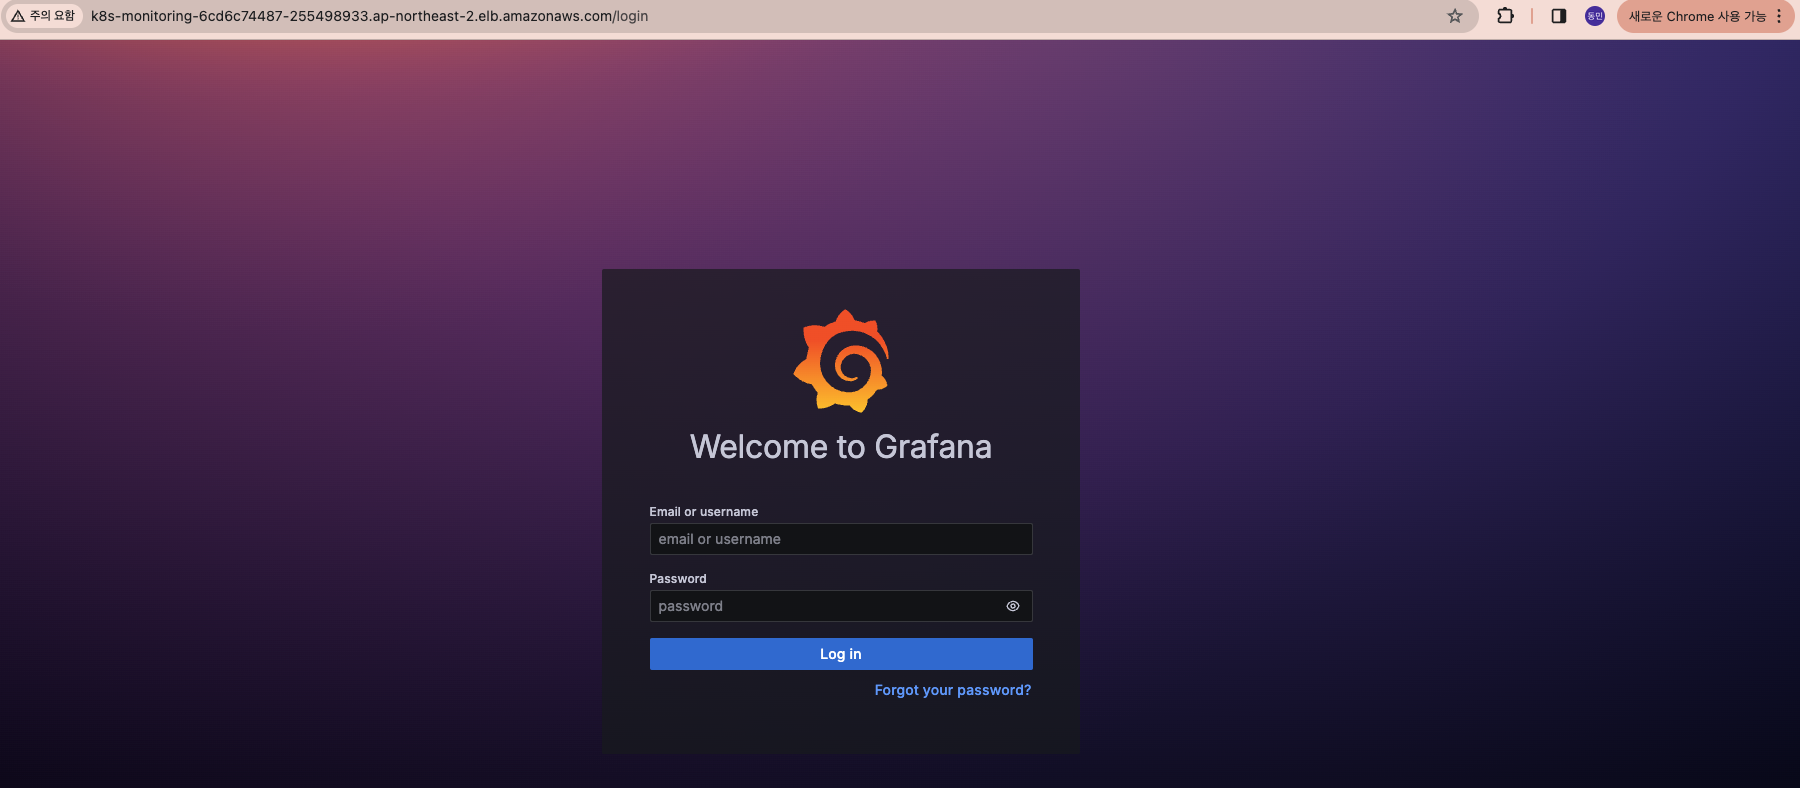
로그인하고, 이전에 했던 것처럼 connection -> datasource로 들어가 보자.
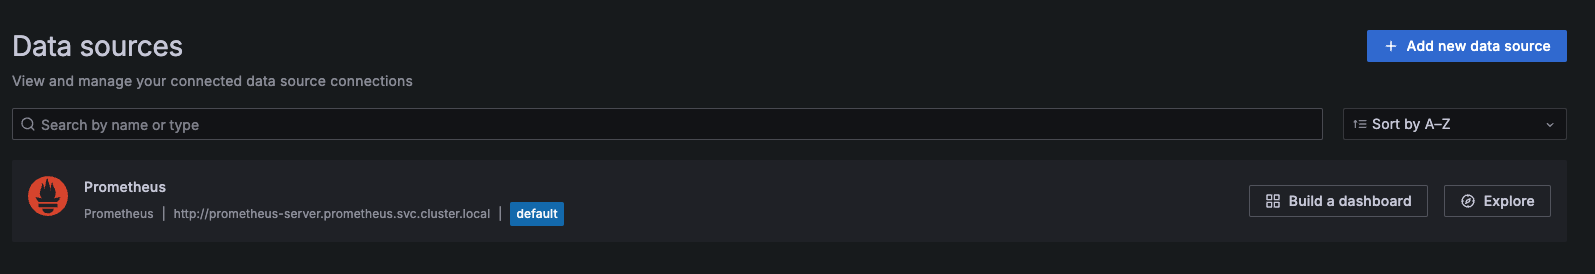
이전에 수동으로 했던 것과 다르게 helm 차트 사용 시 기본적으로 kubenetes의 prometheus service 경로로 등록해 줘서 디폴트로 생성된 것을 볼 수 있다.
대시보드로 가서 template 3119로 생성하면 아래와 같이 대시보드를 완성할 수 있다.
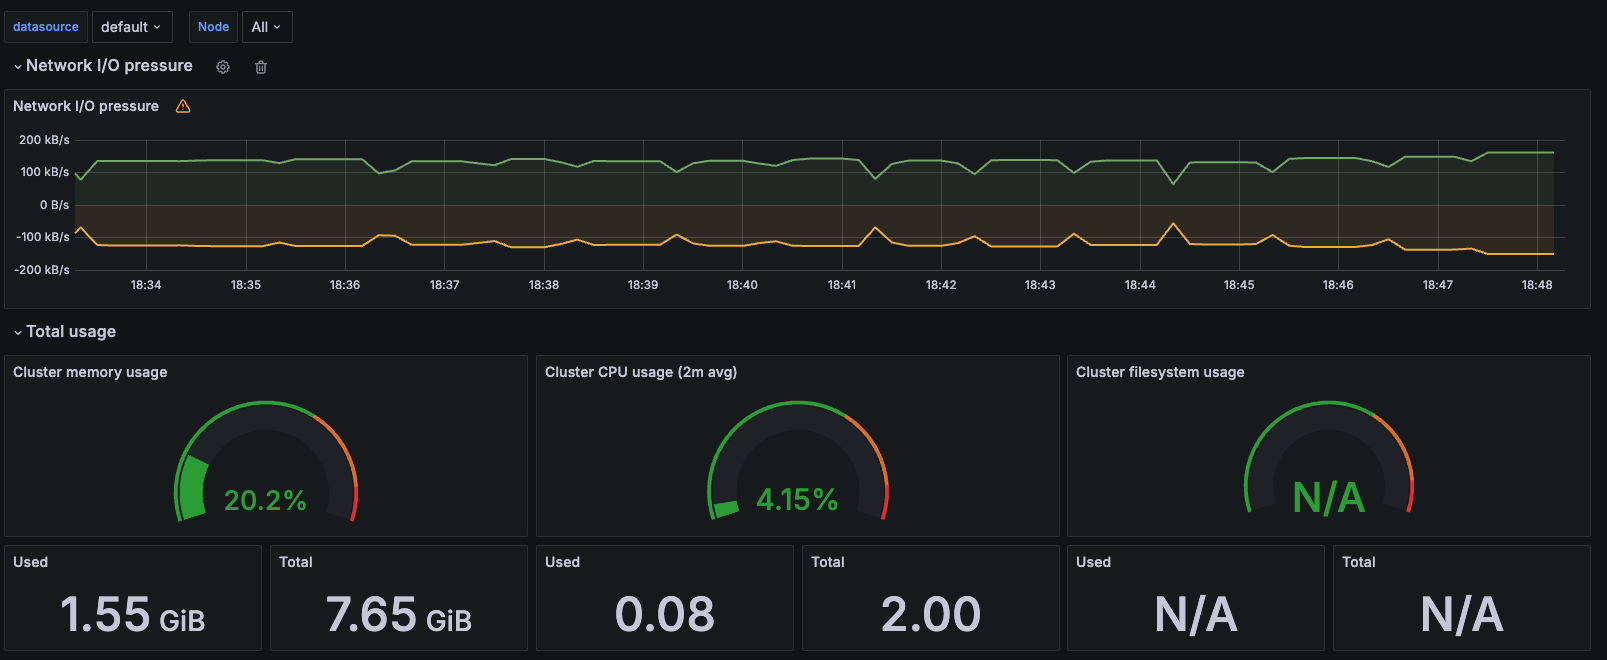
지금까지 가장 간단하게 kubenetes의 리소스들을 프로메테우스와 그라파나를 이용해서 모니터링을 진행해 봤다.
앞으로 그 안에서 동작하는 프로메테우스들의 리소스나 다양한 활용법들을 포스팅해 볼 예정이다.
'DevOps > Monitoring' 카테고리의 다른 글
| Monitoring(Prometheus) 정복하기 - 4 (recording rule) (0) | 2024.04.13 |
|---|---|
| Monitoring(Prometheus) 정복하기 - 3 (PromQL) (0) | 2024.04.02 |
| Monitoring(Prometheus + Grafana) 정복하기 - 1 (EC2 인스턴스 기반 애플리케이션) (0) | 2024.03.21 |
| Monitoring(Prometheus + Grafana) 정복하기 - 0 (인트로) (1) | 2024.03.18 |
댓글을 사용할 수 없습니다.